Measurement Analytics

Managing reputation risk, lifting business performance

CEOs bear the primary responsibility for managing a company’s reputational risk and performance, yet many executives admit to not knowing how to measure reputation in the first place.

Reputation Leaders takes a rigorous approach to tracking and building a reputation, bringing hard numbers to a ‘soft science’. We quantify the perceptions and gaps around reputation to deliver recommendations that link reputation to business outcomes; such as the employer of choice, customer advocacy, positive media, investor support and regulatory licence to operate.

From multiple sources, we measure reputation using key metrics:

Stakeholder perceptions vs expectations

Company reputation vs peer competitors

Reputation attributes driving performance

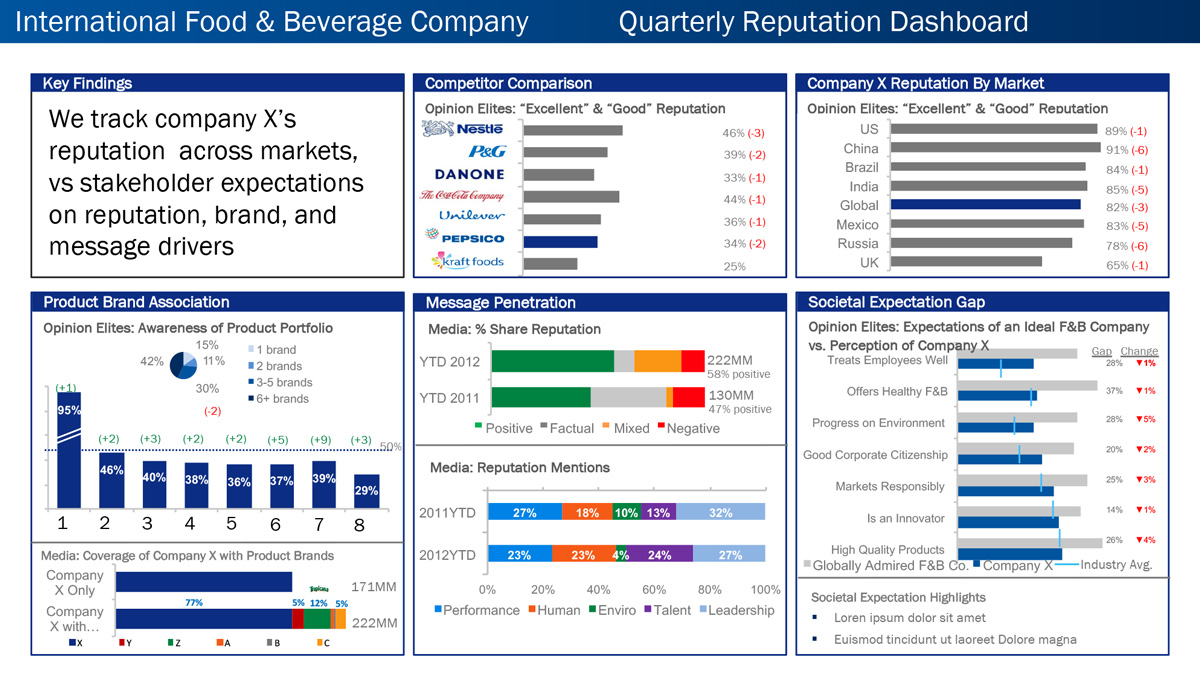
The image is a data visualization dashboard titled “International Food & Beverage Company Quarterly Reputation Dashboard”. Here’s a breakdown of the information presented in the dashboard: Key Findings This section likely summarizes the key takeaways from the data presented in the dashboard. Unfortunately, the specific details are not visible in the image you sent. Competitor Comparison This section compares the client company’s reputation with its competitors across different markets. The client company is labeled "Company X". The other companies listed are Nestle, P&G, Danone, Galili Company, Unilever, Kraft foods, and PepsiCo. For each market, a bar chart shows the percentage of “Excellent” and “Good” Reputation mentions for the client company and its competitors. It appears that the client company’s reputation trails behind some of its competitors in most markets. Company X Reputation by Market This section shows a table that details the client company’s reputation for opinion elites in various markets. Opinion elites are likely a group of people who are seen as influential or knowledgeable about a particular topic. The table shows the following for each market: The percentage of opinion elites who view the client company’s reputation as “Excellent” or “Good”. The change in this percentage since the last measurement. Product Brand Association & Message Penetration These sections likely show how well the client company’s products are associated with its brand and how well the company’s messages are being received by its target audience. Unfortunately, the details of these sections are not visible in the image. Societal Expectation Gap This section appears to compare how the public perceives the client company’s performance on various social responsibility issues with what the public expects from an ideal food and beverage company. The societal expectation gaps are presented on a scale ranging from negative to positive. A positive gap means that the public’s perception is better than their expectations. A negative gap means that the public’s perception is worse than their expectations. The specific societal issues covered in this section are not visible in the image. Media Coverage of Company X with Product Brands This section likely shows how often the media mentions the client company’s products in conjunction with the company itself. Unfortunately, the details of this section are not visible in the image. The overall purpose of this dashboard is likely to communicate to the client company how its reputation is perceived by various stakeholders, including opinion elites in different markets and the general public. The dashboard also appears to show how the client company compares to its competitors in terms of reputation.

We measure the impact of Thought Leadership to show the value:

Enhanced stakeholder reputation

Perception of expertise across audiences

Pipeline meetings / leads generated

Media coverage and positive sentiment

Ownership and share of voice in online conversations

Our clients showcase the results of our thought leadership research at WEF Davos and similar forums
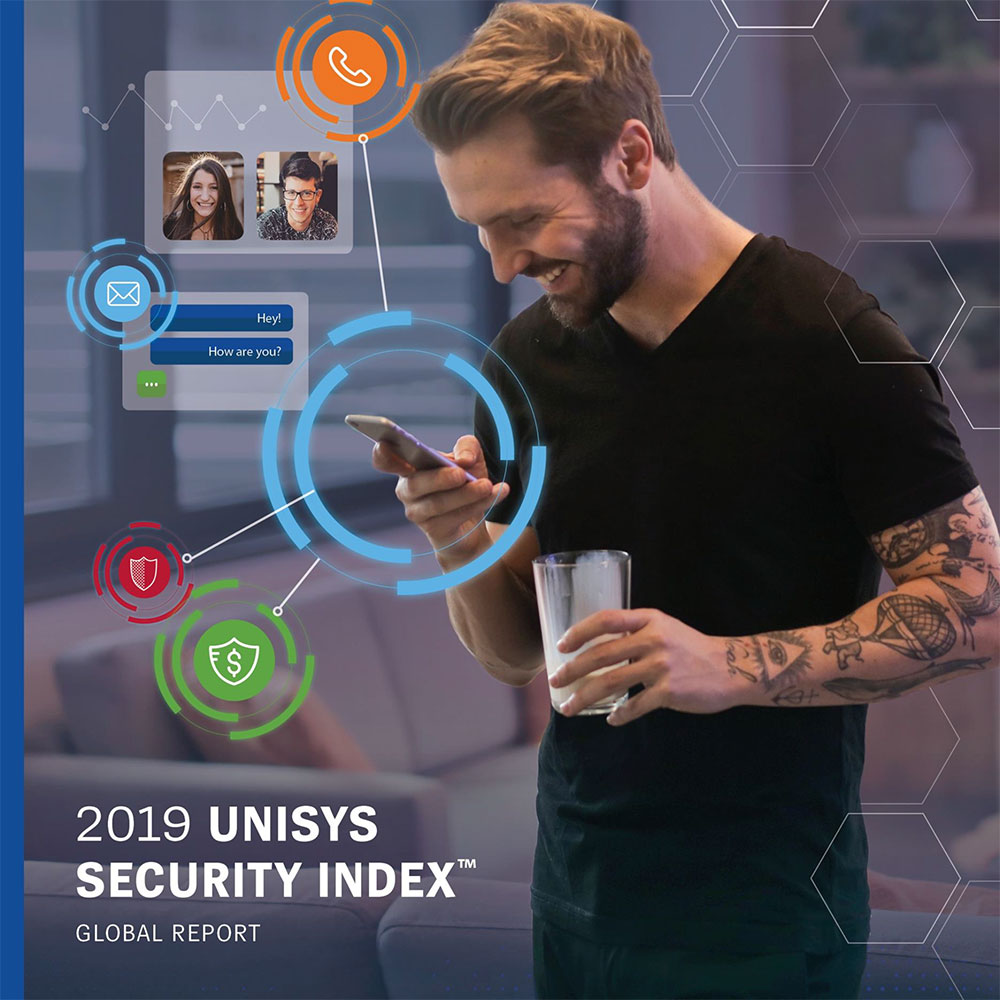
The image is the cover of a report titled “Closing the Skills Gap: What Workers Want” by ManpowerGroup.
Image of a white man, looking at his cellphone and using social media
Mr. Laurence Evans, the CEO of Reputation Leaders attending the Dynata Sammit

Informing decisions using deep analytics and insights

Reputation Leaders use the latest analytics and machine learning tools to investigate, analyse and recommend data driven insights for clients to action. We integrate primary research, desk research, media tools and expert opinion to inform reputation, brand positioning and communications holistically. We conduct primary research in over 80 countries around the world. We identify issues and conversation using tools that access over 300,000 online sources from 205 countries in 87 languages.

The image shows telescopes. It is a stock photo that is often used to represent the concept of a competitive advantage in business. The text in the image says: Get a clear view of your landscape - where your competitors are and where the thought leadership whitespace is that you can own.
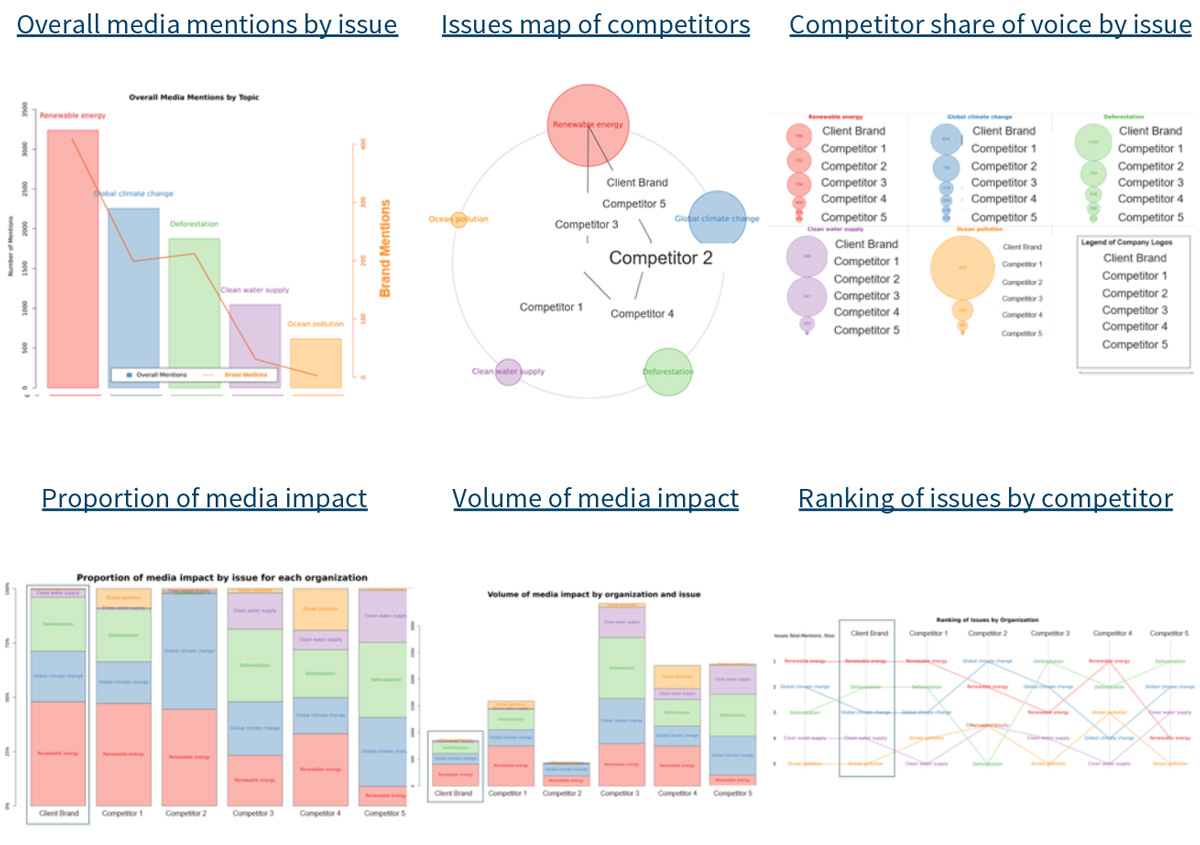
The image is a data visualization dashboard that shows overall media mentions by a magazine, issues map of competitors, and competitor share of voice by issue. Here’s a breakdown of the different sections of the dashboard: Overall media mentions by issue: This is a line graph that shows the volume of media mentions the magazine received over a certain period, likely several months. Each point on the line represents the total number of mentions in a particular issue. Issues map of competitors: This is a heat map that shows how often each competitor is mentioned in the same issue as the client brand. The competitor logos are positioned along a horizontal axis, and the issues are listed along a vertical axis. The color intensity in each cell indicates how many times the client brand and that particular competitor were mentioned in the same issue. A darker color signifies more mentions. Competitor share of voice by issue: This section appears to be a table that shows the percentage of media mentions each competitor received in each issue, compared to the client brand. Overall, this dashboard is likely used by a company to track their media coverage and how it compares to their competitors. By seeing how often they are mentioned in the media, and which publications are mentioning them, they can gain insights into their brand awareness and public perception. They can also use the competitor data to see how their competitors are being portrayed in the media, and identify any areas where they may be able to gain an advantage.