Quantifying the US Developer Drought for Mendix World 2.0

Silicon Valley is out, and the Midwest is in, at least when it comes to supply/demand shortage in hiring U.S. software developers.
Despite COVID-19, states in the U.S. heartland are actively hiring developers. Meanwhile, with remote working becoming a norm, professionals on the coasts are reassessing work-life opportunities and exploring start-up opportunities outside Silicon Valley
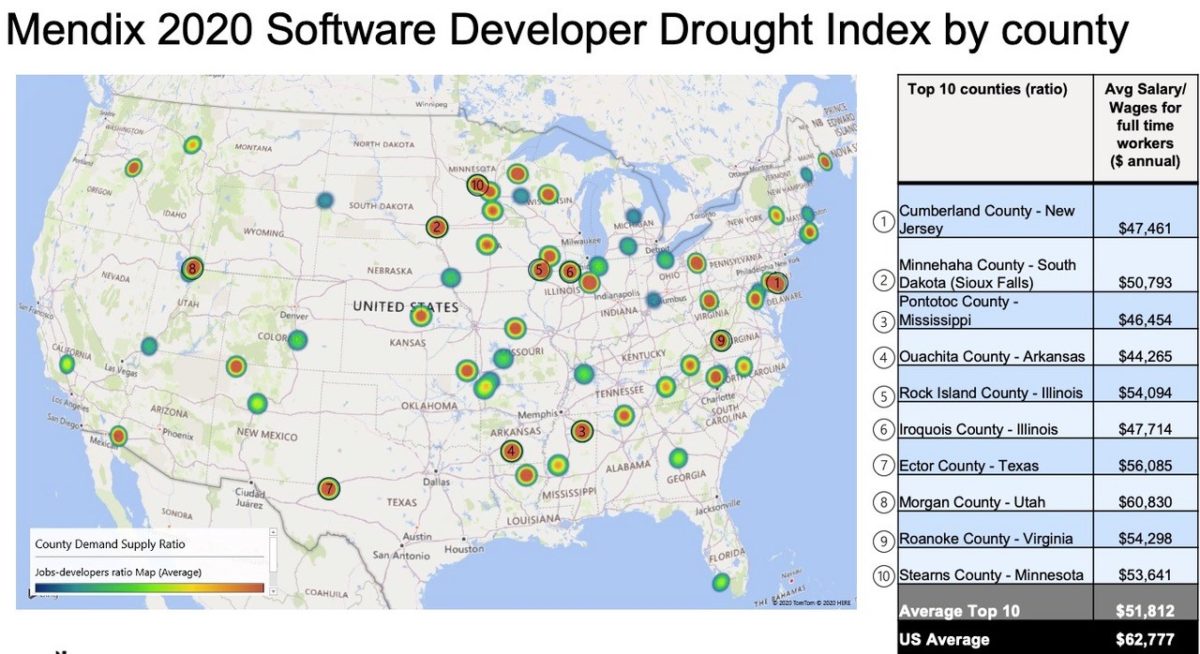
Eight out of 10 U.S. counties with the highest “Developer Demand” shortage are in states in the middle of America, such as South Dakota, Missouri, Arkansas, Illinois, Utah, and Mississippi
92% of job ads on three leading sites for software developers in July/August were for specific locations, showing employers are slow to embrace remote working opportunities
Here are the top areas for developer jobs based on supply and demand.

There’s a drought of software developers in middle America, giving I.T. pros new opportunities beyond Silicon Valley, according to the Mendix Software Developer Drought Index compiled by Reputation Leaders and released August 27, 2020.
Reputation Leaders looked at over 2000 jobs posted during July/August on Glassdoor, Indeed, and Monster, three of the top I.T. hiring sites to measure demand. To measure I.T. talent supply, Reputation Leaders analyzed more than three million U.S. households from the 2018 American Community Survey to determine the number of I.T. professionals in a particular county. Combined with a detailed geo-analysis of job ads for U.S. software developers, we were able to map in detail where the highest demand and lowest supply is for software developers across the U.S.
The gap is most significant in middle America, with a few exceptions.
The index also found that 92% of job listings still list a specific location in the job description despite the recent move toward remote work during the COVID-19 pandemic.
The areas with the highest demand for developers and the lowest supply are:
- Cumberland County, NJ
- Minnehaha County, SD
- Pontotoc County, MS
- Ouachita County, AK
- Rock Island County, IL
- Iroquois County, IL
- Ector County, TX
- Morgan County, UT
- Roanoke County, VA
10.Stearns County, MN
Click here to view a fly-over map of the top 10 developer drought areas.
The study also looked at commute times and average rents in the counties with the most talent shortages. The average monthly rent among the top 10 counties was $707, compared to $1,001 for the U.S. overall. Commute time was 22 minutes compared to 28 minutes for the U.S. overall.
At the state level, the states with the most significant gap between supply and demand for software developers are:
- South Dakota
- Utah
- Nebraska
- Rhode Island
- Alabama
- Maryland
- Virginia
- Illinois
- Wisconsin
- Vermont
Key Takeaways
The tech-based industry managers and workforce, no longer confined to Silicon Valley or other traditional tech hubs, are now beginning to be untethered from any specific geography. The Developer Demand Index pinpoints leading opportunities for companies to leverage remote teams, cloud technology, and low-code software as a new powerhouse strategy for collaborative innovation.
For more information on how to develop thought leadership, please contact info@reputationleaders.ltd


